VILE (or more properly V.I.L.E.) stands for Vitaly's Interval Logging Environment. It is a tool for developers. It is a very lightweight instrumentation facility which can tell you exactly where your software spends its time, and how it got there. It can also show you exactly what happened just before your software managed to e.g. deadlock. It will give you insight into what causes e.g. a nasty race condition. VILE's main purpose was not meant to be yet another profiling tool, i.e. it is not meant to produce histograms of time spent in various functions (although you can certainly get that information from VILE). The real purpose of VILE is to do for software developers what logic analyzers do for hardware developers.
VILE most closely resembles a trace facility. So why write yet another trace facility? Because all freely available trace facilities are fairly intrusive. VILE can be used to instrument functions which take less than a couple of microseconds to execute without adversely affecting the instrumented function's timing. Furthermore, VILE can be used in both user and kernel code. It is thread-safe, SMP-safe, and multi-process-safe, which means that the trace buffer can safely be shared by multiple threads running in the same process, or in different processes, and potentially on different CPUs. VILE does not require any explicit startup/shutdown, so it is useful in debugging problems which occur during early phases of application (or kernel) startup. If your application (or kernel) died with a core dump, then you can still get VILE data from it.
I initially developed VILE as part of my work for Network Appliance, Inc. My thanks go to NetApp for supporting open source philosophy by allowing me to open-source VILE.
Here are some screenshots of a trace produced by instrumenting a simple test
program (source code here)
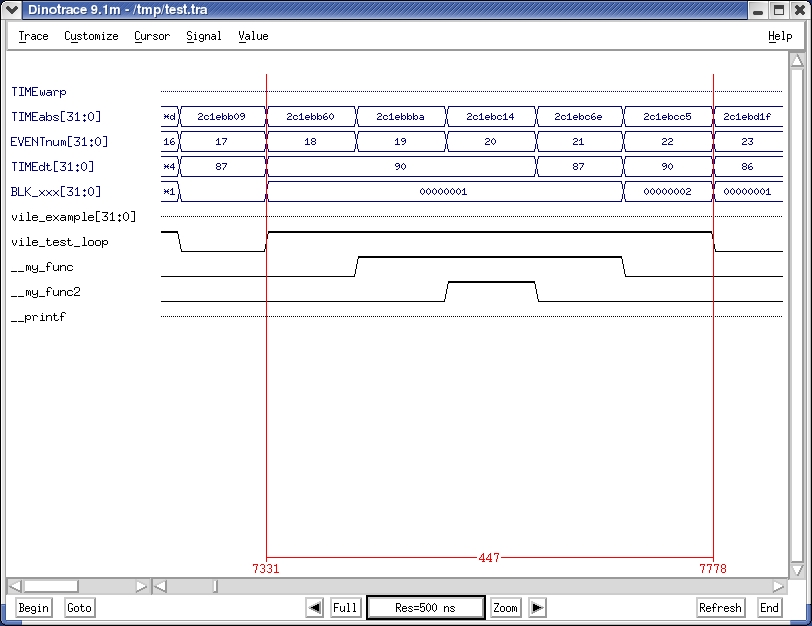
Complete trace
Zooming in (and demonstrating cursors to measure time
between any number of events)
Zooming in even more
Raw trace data in native binary form
Raw trace data in human-readable form
Processed trace data in dinotrace-readable form
Project files can be accessed thru the Sourceforge CVS server. Sorry, I will remedy this situation as soon as I can.
Links: VILE project files